The decalcification protocol is based on the work of:
Tinling, S.P. Giberson, R.T., Kullar, R.S. (2004) Microwave exposure increases bone demineralization rate independent of temperature. J. Microsc., 215:230-235.
| Decalcification with EDTA - Protocol |
Load Cooler set point: Off -- Vacuum set point: Off -- Stirrer speed: Off
|
| Step# |
Description |
User Prompt
(on/off) |
Time
(hr:min:sec) |
Power
(Watts) |
Temp.
(°C) |
Load Cooler
(off/auto/on) |
Vacuum/
Bubble Pump
(off/bub/
vac cycle/
vac on) |
SteadyTemp
Pump (on/off) |
SteadyTemp
temp (°C) |
| 1 |
Decalcification
with EDTA |
Off |
24:0:0 |
150 |
37 |
Off |
Off |
On |
34 |
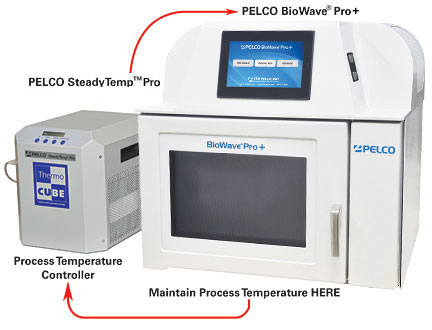
| EDTA decalcification is normally done with the DFR Insert (36200-1, 36200-2 and 36200-3) as shown in Figure 1. The EDTA temperature is maintained using PELCO SteadyTemp™. |
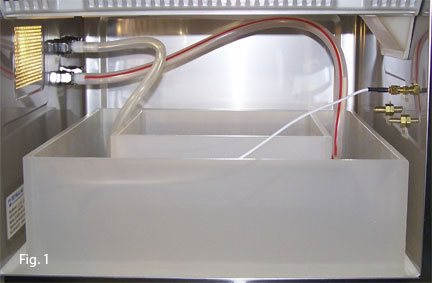 |
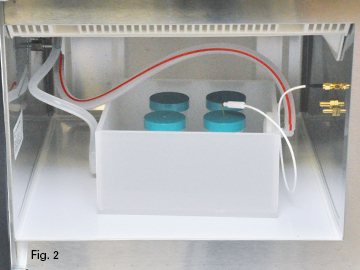
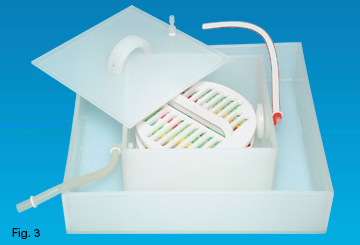
| In Figure 1 EDTA is being circulated by the SteadyTemp. In Figure 2 water is being circulated by the SteadyTemp and the samples are placed in bottles containing the EDTA. Figure 3 shows cassettes being processed (in this case EDTA is being circulated by the SteadyTemp). The lid (white arrow) shown in Figure 3 should be used to reduce evaporation of either water or EDTA during a run. The time in the protocol is arbitrary. Teeth will take up to 3 weeks where a mouse femur might require less than 24 hours.
NOTE: Check fluid levels everyday and set a new run time.
|
 |
 |
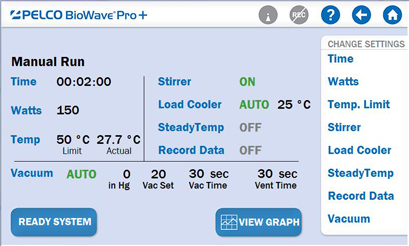
The Main Screen (Fig. 4) on the PELCO BioWave® Pro+ can be used for programming a decalcification run.
A suggested EDTA formulation which has worked very well for the Baylor College of Dentistry is shown below.
0.5M Ethylenediamine tetra-acetic, tetra-sodium salt dihydrate (MW 416.20)
- 1 liter distilled water in a 2-liter beaker
- Add 208.15g of EDTA to 2-liter beaker and stir until dissolved.
- Adjust pH to 7.1-7.2 with 56ml of 5M citric acid (to make add 480.2g of citric acid to 500ml of distilled water).
|
 |
Microwave-assisted Formaldehyde Fixation
The same setup for decalcification is used for formaldehyde fixation. Strategies used in Figures 1-3 have been used successfully for fixing fresh tissue in formalin. 10% neutral buffered formalin can be used or 4% buffered paraformaldehyde. Formalin fixation can proceed by two pathways:
1) low wattage (150W) only (Protocol 1)
2) low wattage (150W) followed by high wattage (650) (Protocol 2)
This protocol is based on the work of:
Galvez, J.J., Giberson, R.T., Cardiff, R.D. (2006) The role of microwave radiation in reducing formaldehyde fixation times. The J. Histotechnol. 29:113-121.
NOTE: High wattage stimulates cross-linking of formaldehyde. Galvez et al. demonstrated that link by electron microscopy, immunohistochemistry and morphology.
| Formaldehyde 150W- Protocol |
| Step# |
Description |
User Prompt
(on/off) |
Time
(hr:min:sec) |
Power
(Watts) |
Temp.
(°C) |
Load Cooler
(off/auto/on) |
Vacuum/
Bubble Pump
(off/bub/
vac cycle/
vac on) |
SteadyTemp
Pump (on/off) |
SteadyTemp
temp (°C) |
| Low Power Fixation - Protocol 1 |
| 1 |
Low Power Fixation |
Off |
1:0:0 |
150 |
40 |
Off |
Off |
On |
34 |
| Low + High Power Fixation - Protocol 2 |
| 1 |
Low Power Step |
Off |
0:38:0 |
150 |
40 |
Off |
Off |
On |
34 |
| 2 |
Low Power Step |
Off |
0:7:0 |
150 |
40 |
Off |
Off |
On |
28 |
| 3 |
High Power Step |
Off |
0:15:0 |
650 |
40 |
Off |
Off |
On |
28 |
Low power fixation can be run off the Main Screen (Fig. 4). The low power plus high power protocol needs to be programmed to make the shift to a lower SteadyTemp setting and then the shift to high power. The temperature probe is positioned in the insert using the probe stand or placed in the port of the lid covering the insert (red arrow Fig. 3).
|
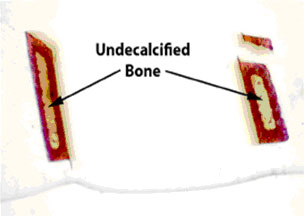
Figure 8. Note the symmetrical pattern of demineralization when microwave methods are employed.
The separated piece at the top broke off during plastic embedding. From the work
of Steven P. Tinling (Tinling et al., 2004),
Otolaryngology Research Laboratory, University of California, Davis 95616.
|
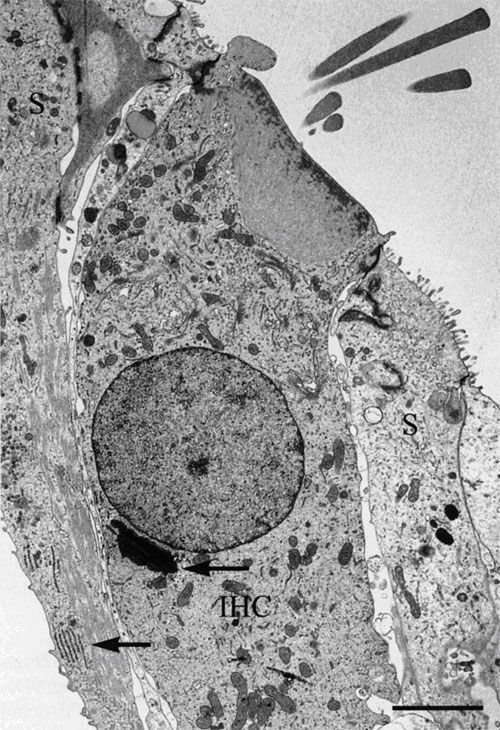 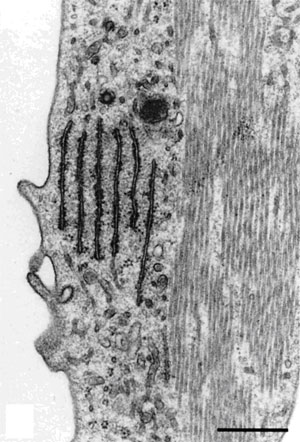 |
Figure 9. Left Image. Image on the left is an electron micrograph of an inner hair cell (IHC) and supporting cells (S)
from a Japanese macaque monkey. The lower left arrow indicates the region shown
at higher magnification in the image to the right. Bar = 3.0µm.
Right Image. In the supporting cells next to the inner hair cell, the rough endoplasmic
reticulum and microtubules are well-preserved. Bar = 0.5 µm.
Reprinted with permission from Madden and Henson, 1997. From a paper on microwave
accelerated decalcification by Madden and Henson, Department of
Pathology and Laboratory Medicine, University of North Carolina, Chapel Hill, NC.
|